Right Ventricle: Difference between revisions
No edit summary |
|||
| (26 intermediate revisions by 3 users not shown) | |||
| Line 1: | Line 1: | ||
==The Right Ventricle== | ==The Right Ventricle== | ||
The contractile function of the RV is difficult to measure due to | The contractile function of the RV is difficult to measure due to its complex anatomy. Historically, there has been very little attention paid to this part of the heart since it was assumed that the RV only played a passive role. However, in the last three decades it has been shown that the function of the RV actually does play an important role in the survival of several disease states. There are a number of echocardiographic measurements to measure RV function which can also provide insights into the mechanisms of RV dysfunction. | ||
==Right ventricular dimensions== | ===Right ventricular dimensions=== | ||
{| class="wikitable" cellpadding="0" cellspacing="0" border="0" width="700px" | {| class="wikitable" cellpadding="0" cellspacing="0" border="0" width="700px" | ||
| Line 62: | Line 62: | ||
|} | |} | ||
==Right ventricular function== | ===Right ventricular function=== | ||
{| class="wikitable" cellpadding="0" cellspacing="0" border="0" width="700px" | {| class="wikitable" cellpadding="0" cellspacing="0" border="0" width="700px" | ||
|- | |- | ||
! | |||
!Reference range | !Reference range | ||
!Mildly abnormal | !Mildly abnormal | ||
| Line 72: | Line 72: | ||
!Severely abnormal | !Severely abnormal | ||
|- | |- | ||
|<nowiki>*</nowiki>'''RV fractional area change, %''' | |||
|align="center"|32–60 | |align="center"|32–60 | ||
|align="center"|25–31 | |align="center"|25–31 | ||
| Line 78: | Line 78: | ||
|align="center"|≤17 | |align="center"|≤17 | ||
|- | |- | ||
|<nowiki>*</nowiki>'''TAPSE, cm''' | |||
|align="center"|1.5-2.0 | |align="center"|1.5-2.0 | ||
|align="center"|1.3-1.5 | |align="center"|1.3-1.5 | ||
|align="center"|1.0-1.2 | |align="center"|1.0-1.2 | ||
|align="center"|<1.0 | |align="center"|<1.0 | ||
|- | |||
|<nowiki>*</nowiki>'''RV MPI''' | |||
|align="center"|<0.28 | |align="center"|<0.28 | ||
| | | | ||
| Line 89: | Line 90: | ||
| | | | ||
|- | |- | ||
|<nowiki>*</nowiki>'''Dp/DT''' | |||
|align="center"|>400mmHg | |align="center"|>400mmHg | ||
| | | | ||
| | | | ||
| | | | ||
|- | |||
|<nowiki>*</nowiki>'''RV TDI doppler (S'), cm/s''' | |||
|align="center"|>11.5 | |align="center"|>11.5 | ||
| | | | ||
| Line 100: | Line 102: | ||
| | | | ||
|- | |- | ||
|<nowiki>*</nowiki>Reference limits and partition values of right ventricular size and function as measured in apical 4-chamber view | |colspan="5"|<nowiki>*</nowiki>'''Reference limits and partition values of right ventricular size and function as measured in apical 4-chamber view.<cite>1</cite>''' | ||
|} | |} | ||
==Fractional Area Change== | ==Fractional Area Change== | ||
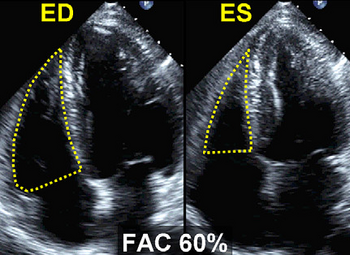
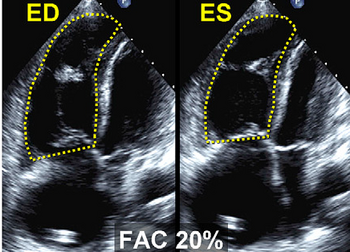
With this method, the percentage difference in the traced RV during systole and diastole is assessed. Here again the apical 4CH is used for accuracy. A difference in surface area of less than 35%, fits with a reduced function. This method is frequently used in clinical practice. | |||
{| class="wikitable" cellpadding="0" cellspacing="0" border="0" | |||
|- | |||
![[Image:RVFAC01.png|350px]] | |||
Good RV function | |||
![[Image:RVFAC02.png|350px]] | |||
Decreased RV function | |||
|} | |||
==Dp/DT== | ==Dp/DT== | ||
These methods make use of the determination of the speed of movement of the myocardium itself and of the determination of pressure differences between the compartments of the right heart. A simple physiological measure of RV function is the pressure produced during RV systole. This can be determined as Dp/DT, and for this purpose the systolic acceleration speed of the tricuspid regurgitation signal is determined during the isovolumetric contraction phase. This can be done by measuring the time interval in the continuous wave signal where TR is between 1 and 2 m/s. | |||
Therefore, by definition, the time interval for a differential pressure of 12mmHg is assessed (4V^2). This number, 12, is divided by the time interval in seconds, a result less than 400 mmHg/sec is an indication for a reduced right ventricular function. | |||
Click [http://csecho.ca/cardiomath/?eqnHD=echo&eqnDisp=dpdtrvc '''here'''] for dP/DT calculation. | |||
==RV myocardial performance index (MPI)== | ==RV myocardial performance index (MPI)== | ||
The MPI or Tei index is a dimensionless index and a measure of efficiency of the systole. This index is the ratio between the sum of both isovolumic times and ejection time. The isovolumic relaxation time is the time between the closing of the pulmonary valve and the beginning of the opening of the tricuspid valve. The time in which blood flows through the pulmonary valve is named the ejection time. The larger the portion of the time that is used for actual ejection of blood, the better the function of the chamber. This is the underlying idea of the performance index. So the higher the index, the less efficient the RV. | |||
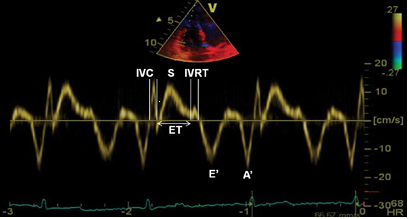
Unfortunately, it is often rather difficult to measure. The easiest method to assess the Tei index is a tissue doppler signal of the RV in a AP4CH view. The tissue Doppler method allows for measurement of the Tei index or MPI as well as S', E', and A', all from a single image. You divide the isovolumic time (assessed as the time between TV closure (end of A') and opening (start of E') minus the ejection time) by the ejection time: | |||
TEI index (RV MPI) = IVCT + IVRT / RVET = TCOT - RVET / RVET | |||
The normal values of left and right ventricle differ. Due to the high pressures which must be generated by the LV, the isovolumic times of the LV are relatively long. The RV generates less pressure and therefore the index also lower with an average at around 0.28. A Tei index above 0.55 (TDI) is considered abnormal. | |||
{| class="wikitable" cellpadding="0" cellspacing="0" border="0" | |||
|- | |||
![[Image:RVMPI.png]] | |||
RV MPI measured using TDI and PW in TVannulus. | |||
|} | |||
Click [http://csecho.ca/cardiomath/?eqnHD=echo&eqnDisp=mpiteirv '''here'''] for MPI calculation. | |||
The determination of the RV function, occurs regularly on the eye, or even not at all. Unfortunately, this ensures that many RV pathology is not recognized. Using various echo techniques may result in a good statement about the function of the RV. Never restrict to one technique, but always more views to assess its function. This reduces the risk of troublesome and even erroneous interpretations.<cite>2</cite> | |||
==References== | ==References== | ||
<biblio> | <biblio> | ||
#1 pmid=20620859 | #1 pmid=20620859 | ||
#2 pmid=15842967 | |||
</biblio> | </biblio> | ||
==External links== | |||
* [https://www.techmed.sk/en/echo/new-examination/ Online Free Echocardiography Learning Platform (TECHmED)] | |||
Latest revision as of 13:00, 23 February 2021
The Right Ventricle
The contractile function of the RV is difficult to measure due to its complex anatomy. Historically, there has been very little attention paid to this part of the heart since it was assumed that the RV only played a passive role. However, in the last three decades it has been shown that the function of the RV actually does play an important role in the survival of several disease states. There are a number of echocardiographic measurements to measure RV function which can also provide insights into the mechanisms of RV dysfunction.
Right ventricular dimensions
| Reference range | Mildly abnormal | Moderately abnormal | Severely abnormal | |
|---|---|---|---|---|
| RV dimensions | ||||
| Basal RV diameter (RVD 1), cm | 2.0–2.8 | 2.9–3.3 | 3.4–3.8 | ≥3.9 |
| Mid-RV diameter (RVD 2), cm | 2.7–3.3 | 3.4–3.7 | 3.8–4.1 | ≥4.2 |
| Base-to-apex length (RVD 3), cm | 7.1–7.9 | 8.0–8.5 | 8.6–9.1 | ≥9.2 |
| *RV diastolic area, cm2 | 11–28 | 29–32 | 33–37 | ≥38 |
| *RV systolic area, cm2 | 7.5–16 | 17–19 | 20–22 | ≥23 |
| RVOT diameters | ||||
| Above aortic valve (RVOT 1), cm | 2.5–2.9 | 3.0–3.2 | 3.3–3.5 | ≥3.6 |
| Above pulmonic valve (RVOT 2), cm | 1.7–2.3 | 2.4–2.7 | 2.8–3.1 | ≥3.2 |
| *Reference limits and partition values of right ventricular size and function as measured in apical 4-chamber view. | ||||
Right ventricular function
| Reference range | Mildly abnormal | Moderately abnormal | Severely abnormal | |
|---|---|---|---|---|
| *RV fractional area change, % | 32–60 | 25–31 | 18–24 | ≤17 |
| *TAPSE, cm | 1.5-2.0 | 1.3-1.5 | 1.0-1.2 | <1.0 |
| *RV MPI | <0.28 | |||
| *Dp/DT | >400mmHg | |||
| *RV TDI doppler (S'), cm/s | >11.5 | |||
| *Reference limits and partition values of right ventricular size and function as measured in apical 4-chamber view.[1] | ||||
Fractional Area Change
With this method, the percentage difference in the traced RV during systole and diastole is assessed. Here again the apical 4CH is used for accuracy. A difference in surface area of less than 35%, fits with a reduced function. This method is frequently used in clinical practice.

Good RV function |

Decreased RV function |
|---|
Dp/DT
These methods make use of the determination of the speed of movement of the myocardium itself and of the determination of pressure differences between the compartments of the right heart. A simple physiological measure of RV function is the pressure produced during RV systole. This can be determined as Dp/DT, and for this purpose the systolic acceleration speed of the tricuspid regurgitation signal is determined during the isovolumetric contraction phase. This can be done by measuring the time interval in the continuous wave signal where TR is between 1 and 2 m/s.
Therefore, by definition, the time interval for a differential pressure of 12mmHg is assessed (4V^2). This number, 12, is divided by the time interval in seconds, a result less than 400 mmHg/sec is an indication for a reduced right ventricular function.
Click here for dP/DT calculation.
RV myocardial performance index (MPI)
The MPI or Tei index is a dimensionless index and a measure of efficiency of the systole. This index is the ratio between the sum of both isovolumic times and ejection time. The isovolumic relaxation time is the time between the closing of the pulmonary valve and the beginning of the opening of the tricuspid valve. The time in which blood flows through the pulmonary valve is named the ejection time. The larger the portion of the time that is used for actual ejection of blood, the better the function of the chamber. This is the underlying idea of the performance index. So the higher the index, the less efficient the RV.
Unfortunately, it is often rather difficult to measure. The easiest method to assess the Tei index is a tissue doppler signal of the RV in a AP4CH view. The tissue Doppler method allows for measurement of the Tei index or MPI as well as S', E', and A', all from a single image. You divide the isovolumic time (assessed as the time between TV closure (end of A') and opening (start of E') minus the ejection time) by the ejection time:
TEI index (RV MPI) = IVCT + IVRT / RVET = TCOT - RVET / RVET
The normal values of left and right ventricle differ. Due to the high pressures which must be generated by the LV, the isovolumic times of the LV are relatively long. The RV generates less pressure and therefore the index also lower with an average at around 0.28. A Tei index above 0.55 (TDI) is considered abnormal.

RV MPI measured using TDI and PW in TVannulus. |
|---|
Click here for MPI calculation.
The determination of the RV function, occurs regularly on the eye, or even not at all. Unfortunately, this ensures that many RV pathology is not recognized. Using various echo techniques may result in a good statement about the function of the RV. Never restrict to one technique, but always more views to assess its function. This reduces the risk of troublesome and even erroneous interpretations.[2]
References
- Rudski LG, Lai WW, Afilalo J, Hua L, Handschumacher MD, Chandrasekaran K, Solomon SD, Louie EK, and Schiller NB. Guidelines for the echocardiographic assessment of the right heart in adults: a report from the American Society of Echocardiography endorsed by the European Association of Echocardiography, a registered branch of the European Society of Cardiology, and the Canadian Society of Echocardiography. J Am Soc Echocardiogr. 2010 Jul;23(7):685-713; quiz 786-8. DOI:10.1016/j.echo.2010.05.010 |
- Dokainish H, Abbey H, Gin K, Ramanathan K, Lee PK, and Jue J. Usefulness of tissue Doppler imaging in the diagnosis and prognosis of acute right ventricular infarction with inferior wall acute left ventricular infarction. Am J Cardiol. 2005 May 1;95(9):1039-42. DOI:10.1016/j.amjcard.2004.12.056 |